Articles
John Deere MY27 6R Tractor Delivers Enhanced Comfort and Increased Efficiency for Farmers and Ranchers
For Immediate Release June 8th, 2026 John Deere MY27 6R Tractor Delivers Enhanced Comfort and Increased Efficiency for Farmers and Ranchers New 6R options provide versatile midsize tractor solutions for any farm OLATHE, Kansas (June 8, 2026) – John Deere (NYSE: DE) announced today the launch of the latest generation of its 6R Series tractors, designed […]
READ MORE
FARM Program Publishes 2026 Drug Residue Prevention Manual
FOR IMMEDIATE RELEASE Thursday, June 4, 2026 FARM Program Publishes 2026 Drug Residue Prevention Manual ARLINGTON, VA – The National Dairy Farmers Assuring Responsible Management (FARM) Program today released its 2026-2027 Milk & Dairy Beef Drug Residue Prevention Reference Manual, equipping farmers with an educational tool that promotes best management practices for responsible and judicious use of antimicrobials […]
READ MORE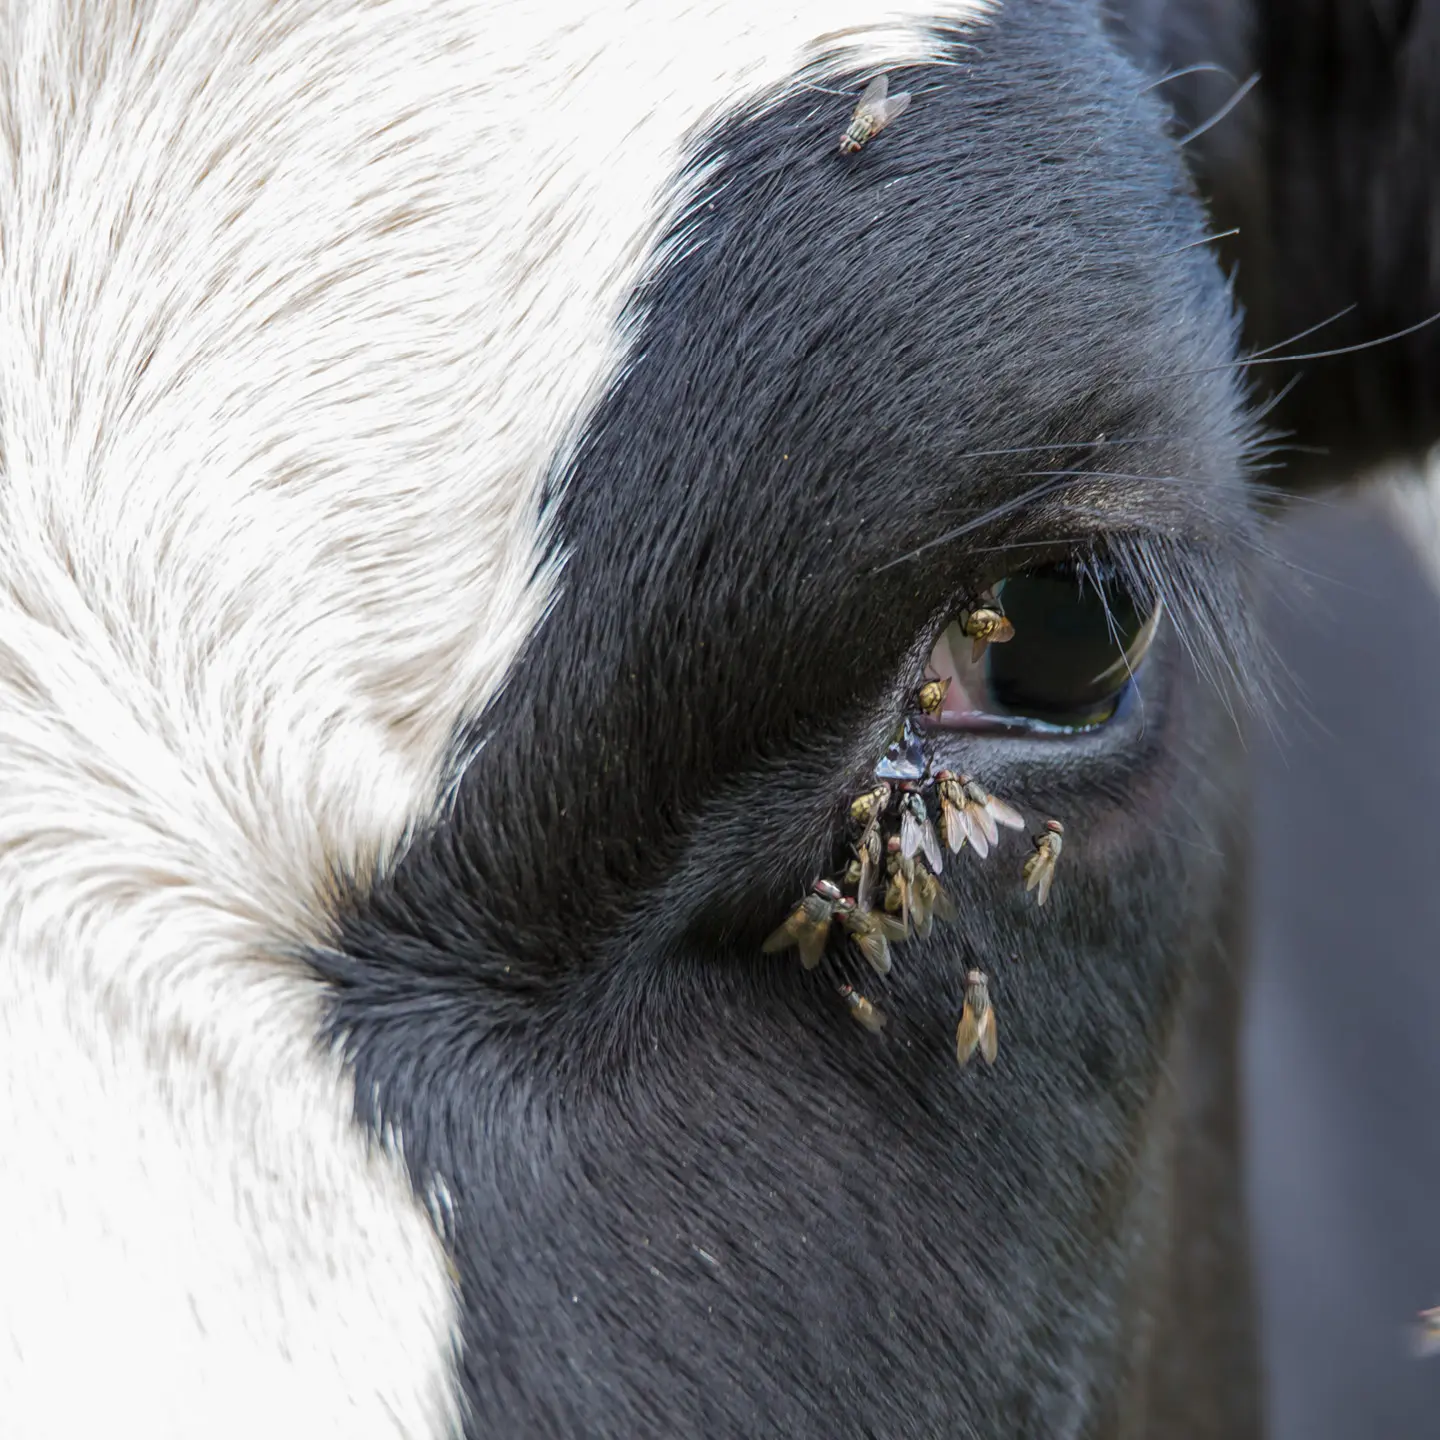
Fly Control in Dairy Cattle Operations
Fly Control in Dairy Cattle Operations Flies are more than just a summer headache on dairy farms. They stress cows, spread disease, lower milk output, and cost farmers real money every year. When fly numbers get high, cows spend less time eating and resting. Instead, they stomp their feet, twitch their skin, swish their tails, […]
READ MORE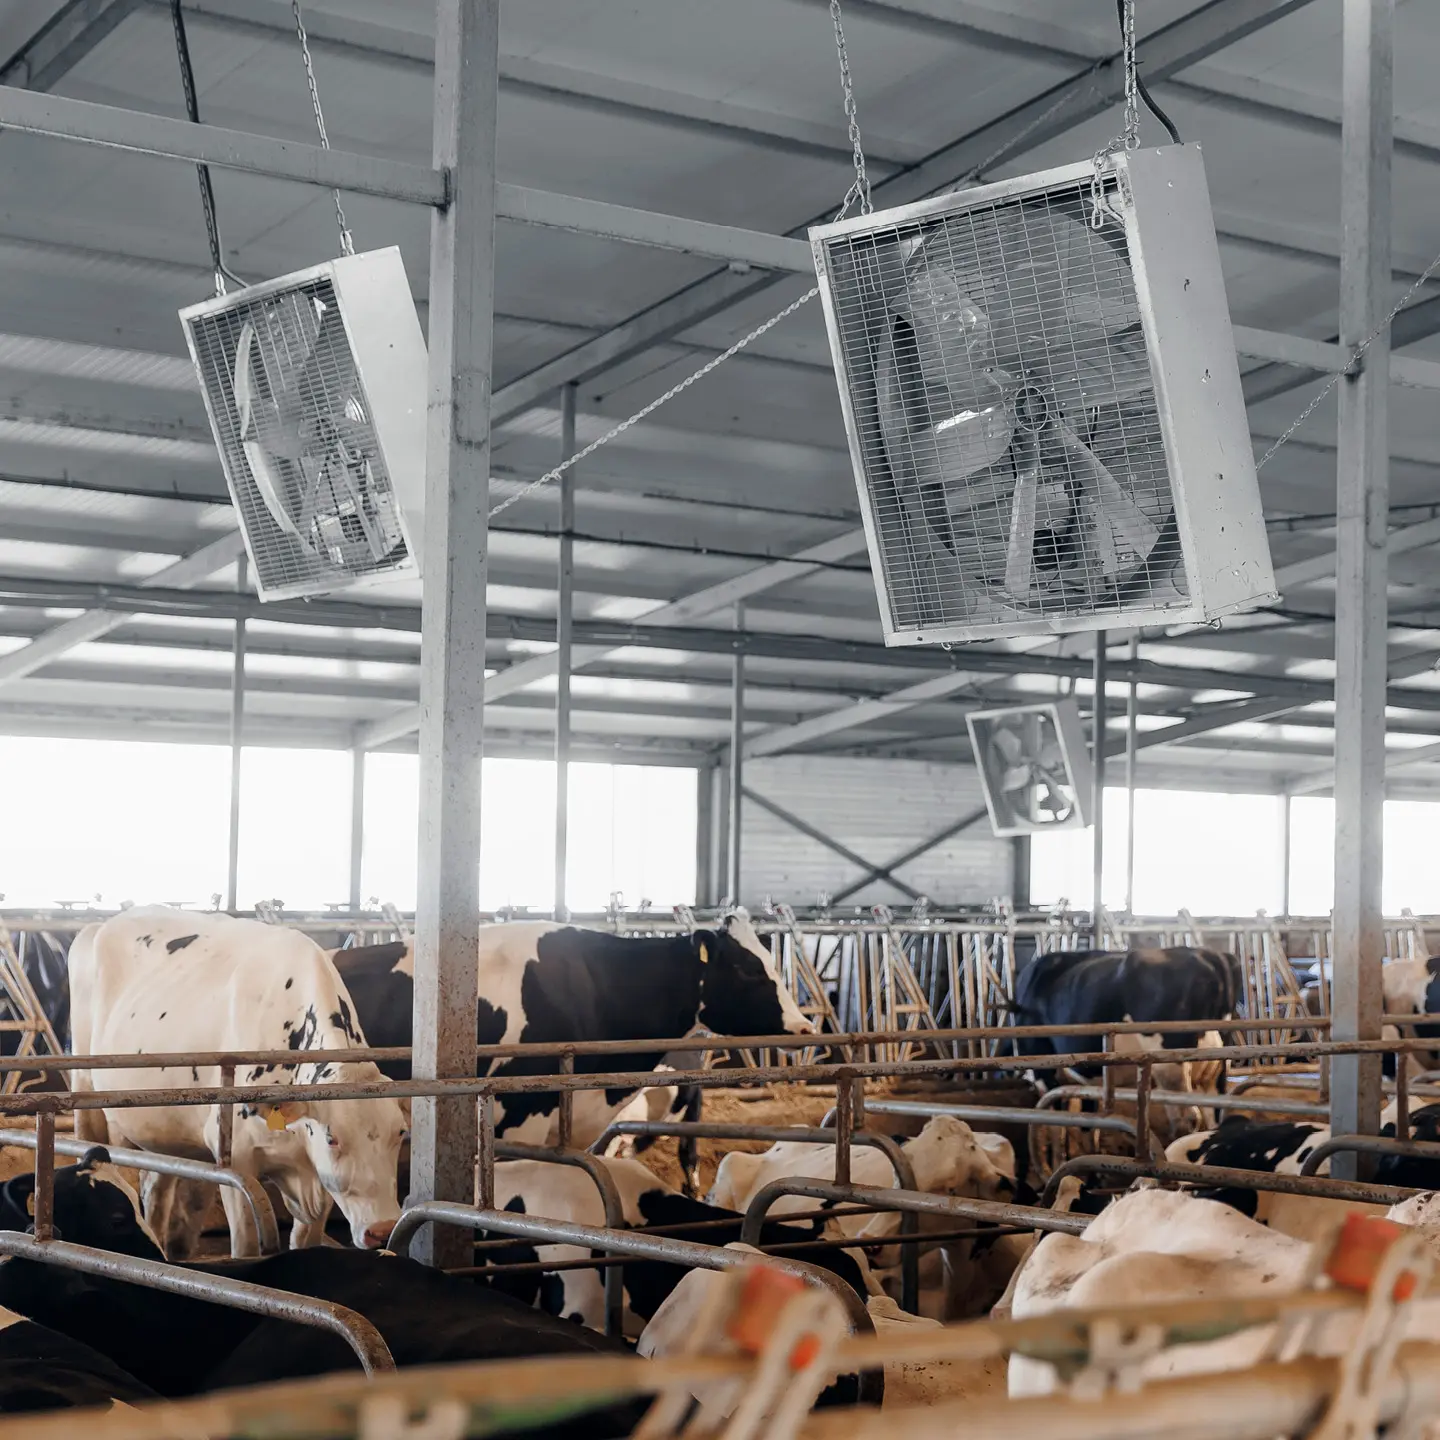
Summer Heat Strategies that Work
Summer Heat Abatement Strategies that Work Sponsored by Bio-Vet Seasonal heat abatement is one of the most important focuses for a productive dairy herd. Even if you aren’t in an exceptionally warm region, the research is very clear that heat stress impacts lactating cows and it happens sooner than you think. Beyond the obvious drop […]
READ MORE